How to Analyze Before/After Results of Meta (Facebook)
Overview
You have just set up Meta (Facebook) tracking via Elevar! But now you want to see the impact on CPC & ROAS in Facebook.
After you have been running your Meta (Facebook) campaigns via Elevar's tracking for at least 7 days (but ideally 1 month), follow the below steps to set up a before/after report in Meta (Facebook) Ads Reporting.
How to Set Up a Before/After Report in Meta (Facebook)
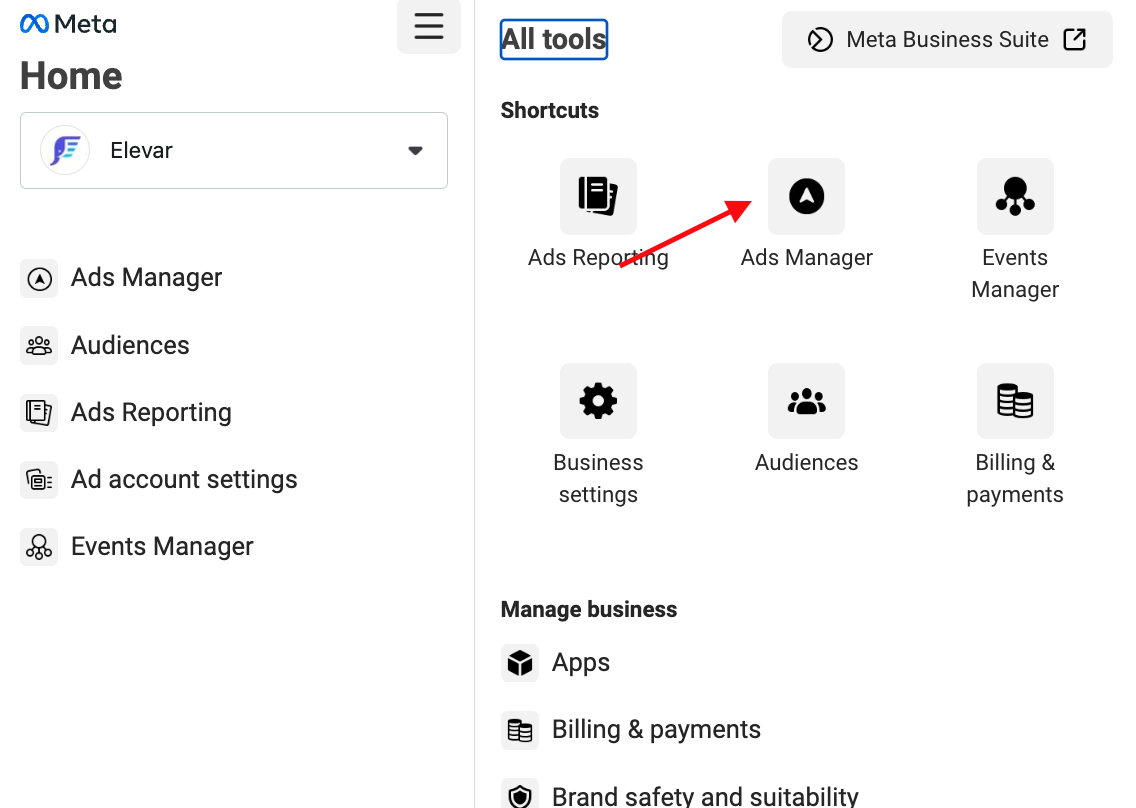
Step 1: Navigate to Ads Manager
Start in Business Settings > Click on Ads Manager in your Navigation Bar
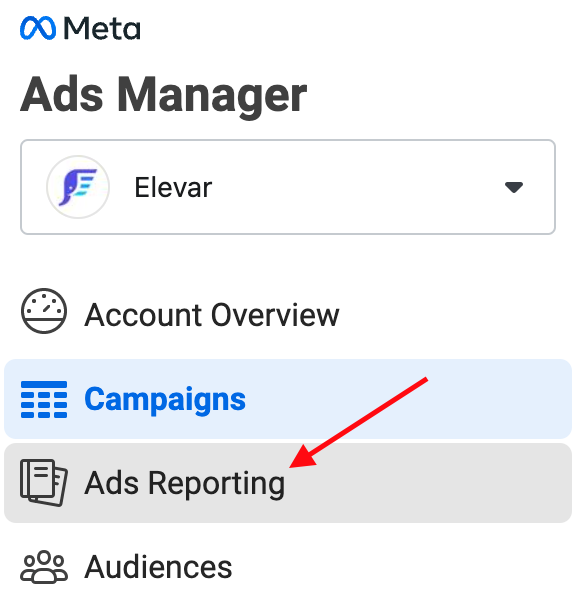
Step 2: Access Ads Reporting
Within Ads Manager, select ads reporting to begin your analysis journey.
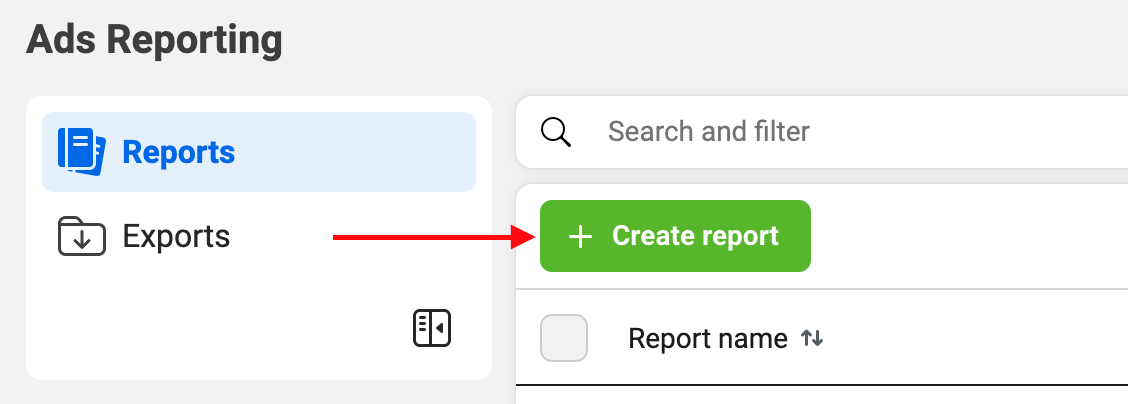
Step 3: Create Your Report
Select Create Report
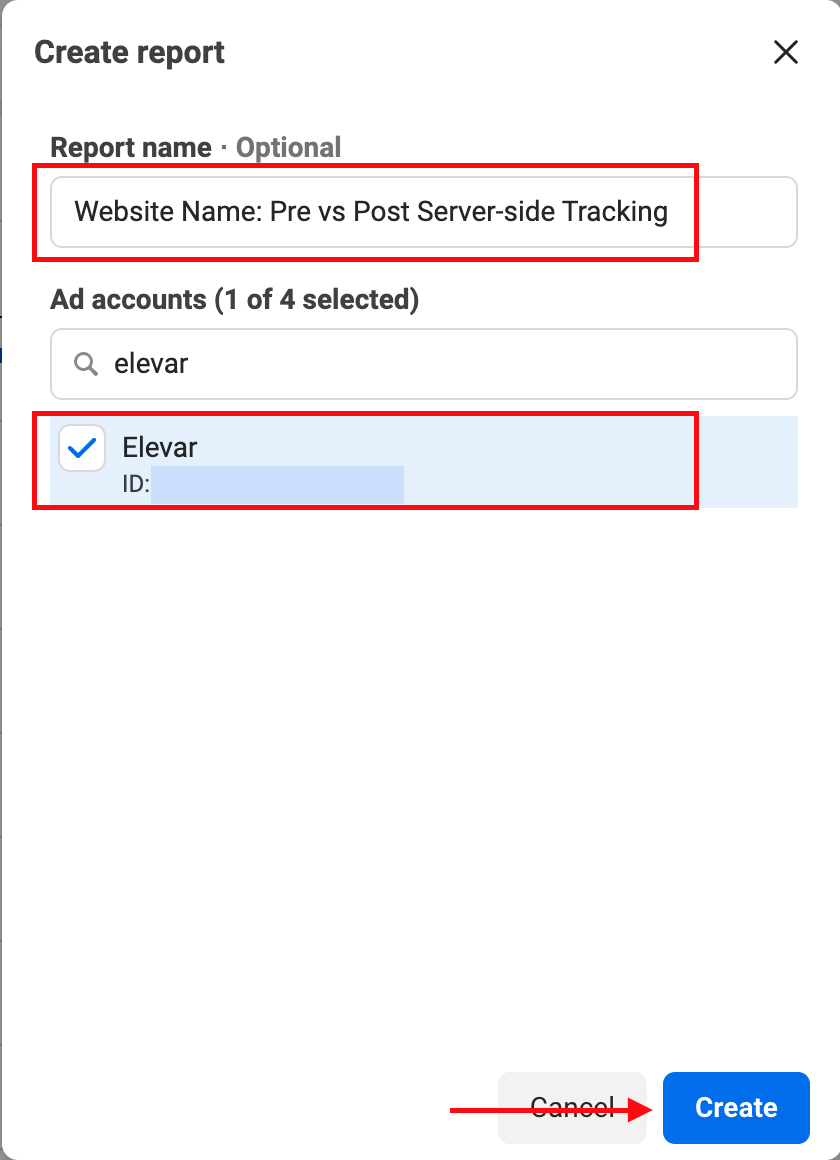
Add a title like "MERCHANT NAME: Pre vs Post Server-side Tracking" & select your Ad Account. Then select Create.
Set up your date range and metrics
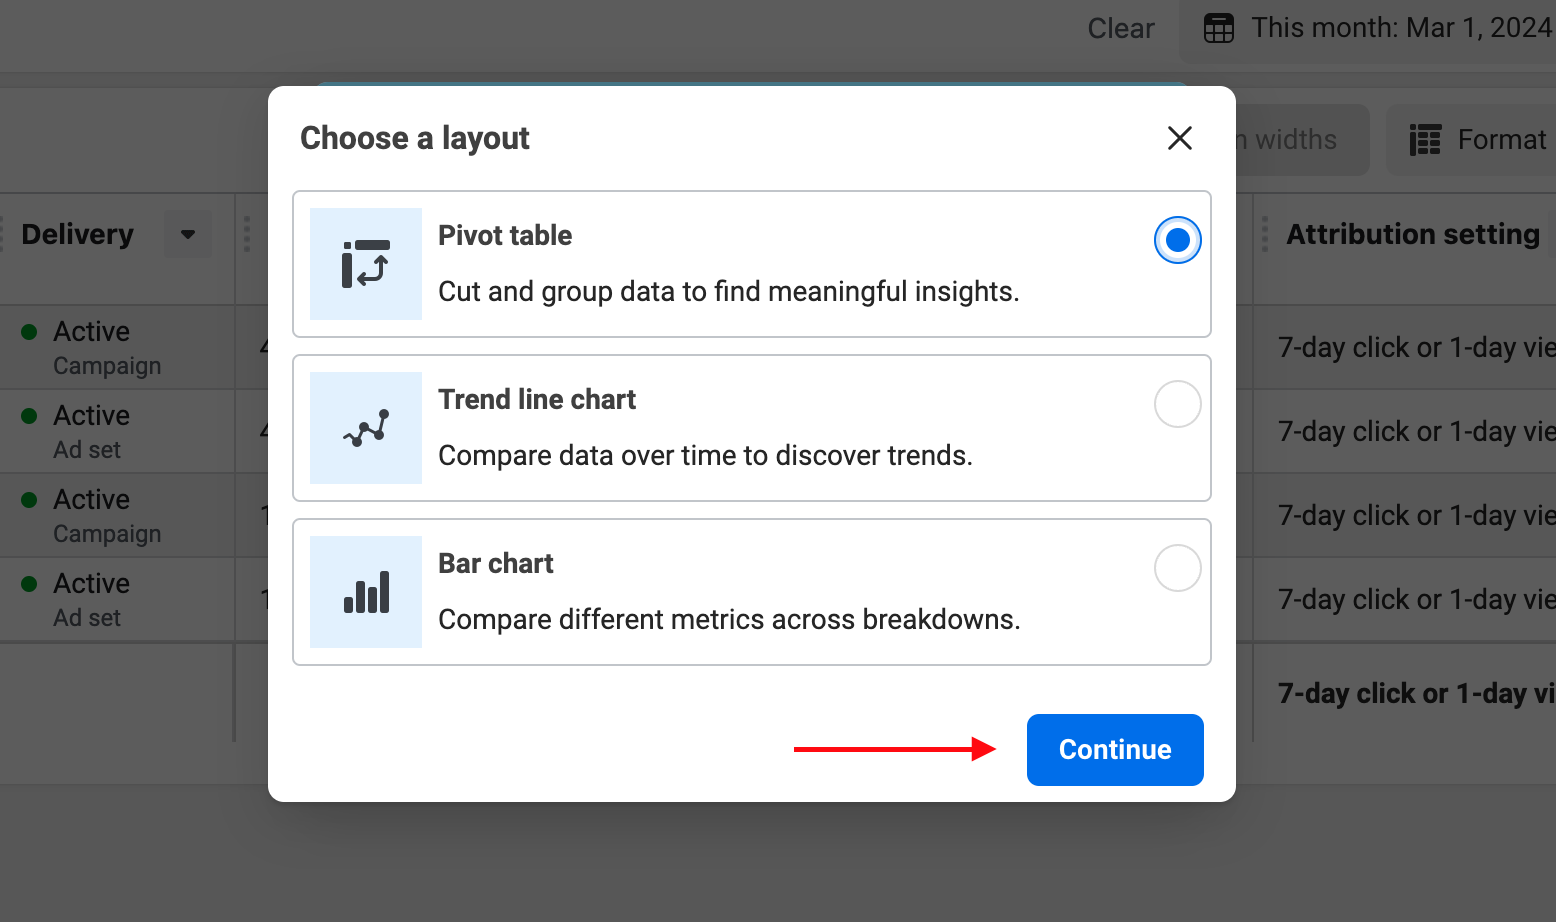
Choose the Pivot Table layout > press Continue.
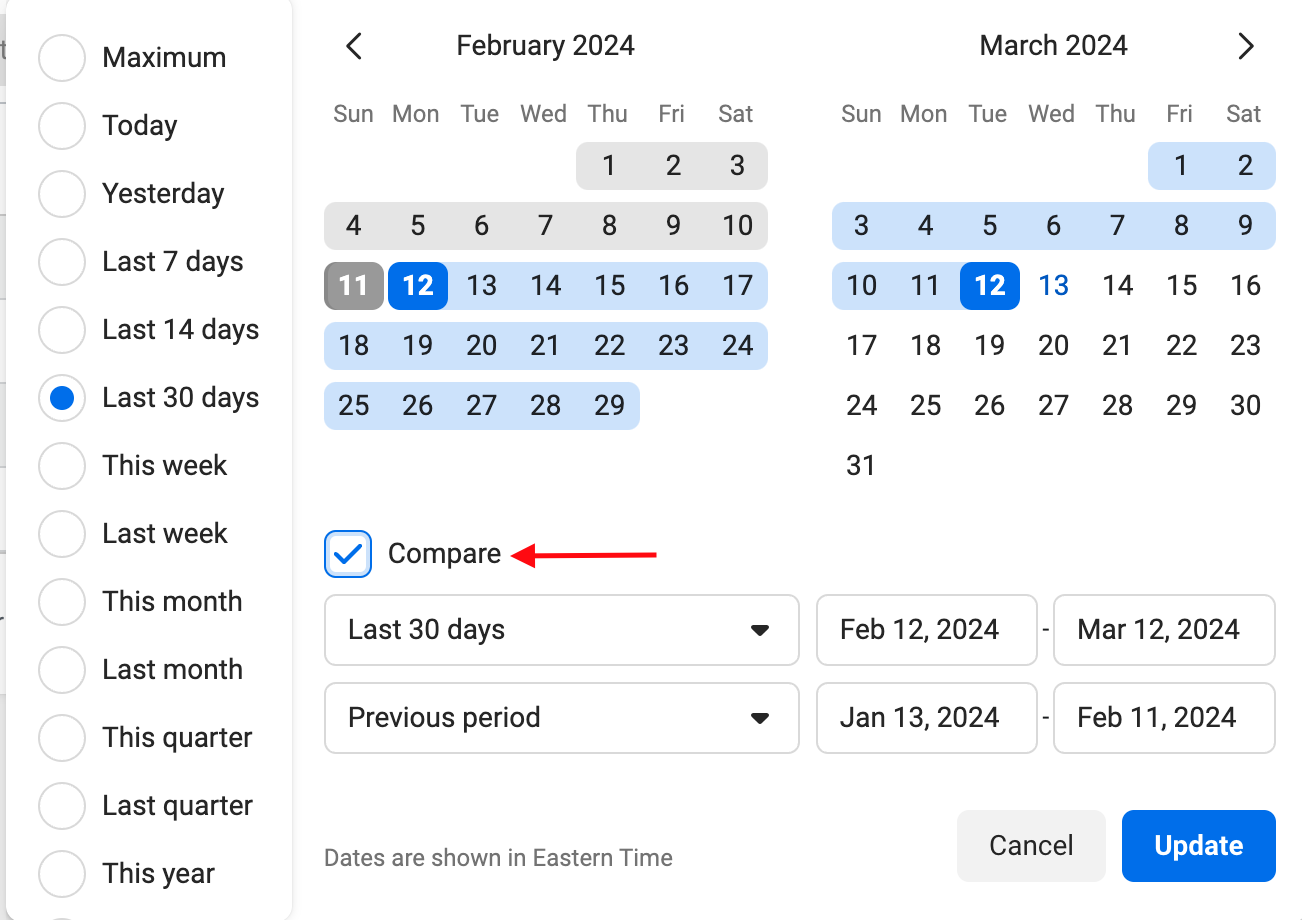
Edit the date range so that:
- The selected date range starts the day after you switched your Facebook tracking to Elevar (Tip: you can find this date in your History settings in Elevar)
- The Compare setting is enabled
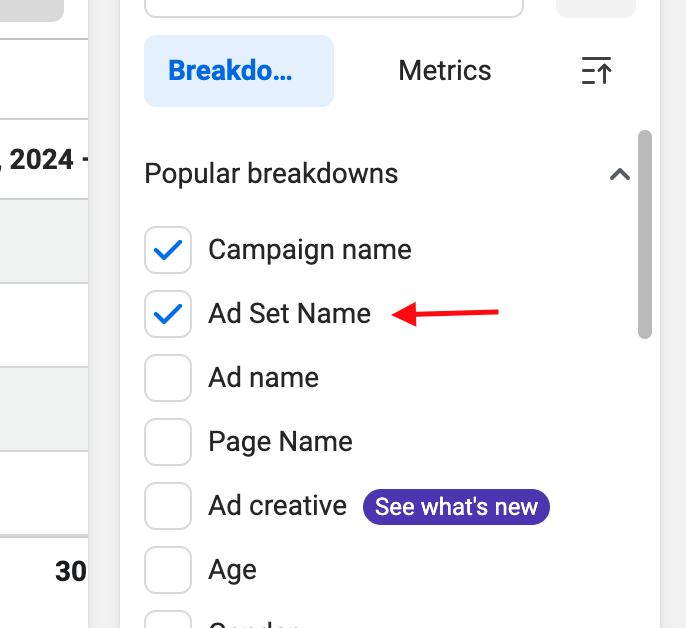
Remove Ad Set Name from the Breakdown column
Edit the Metrics column so that only the metrics you care about are displayed. For example, I removed:
- Amount spent
- Impressions
- Reach
- Results
- Delivery
- Frequency
- Attribution Settings
- Schedule
And then I enabled:
- CPC
- CPM
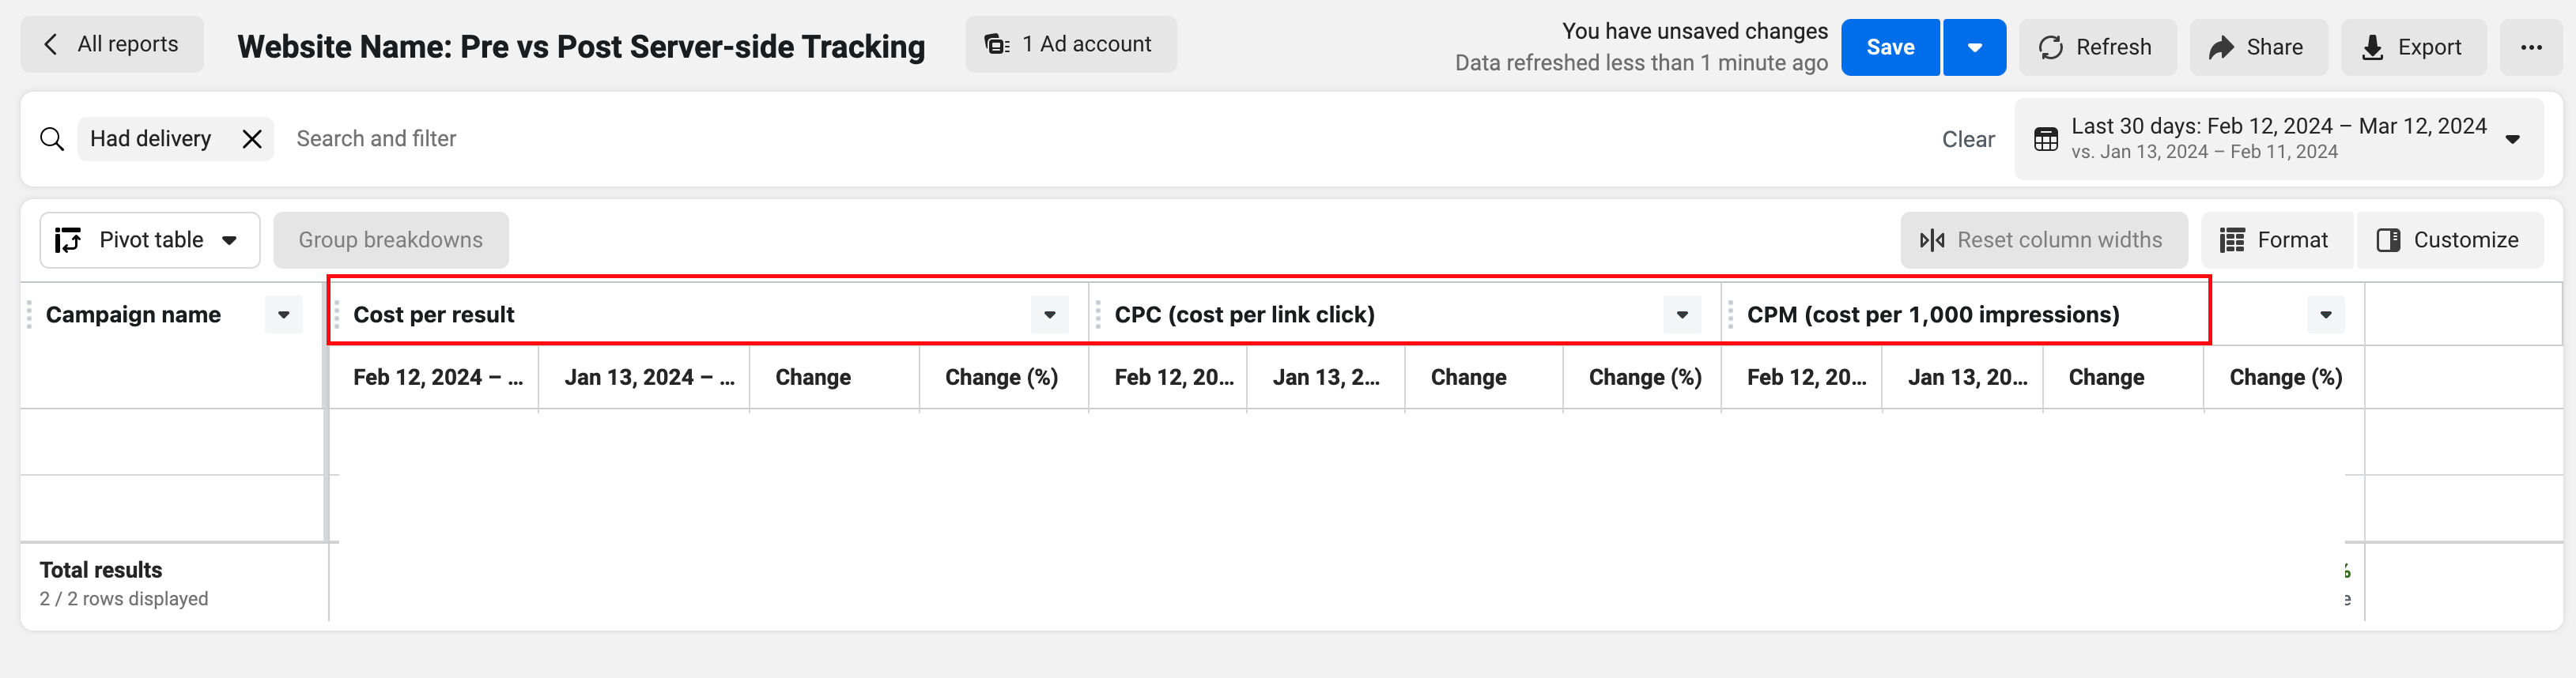
This means that the report only shows Cost per Result, CPC, and CPM to compare the before/after:
Step 5: Analyze the Results
Look for a reduction in CPC, CPA, and CPM and/or increases in ROAS to indicate a successful optimization.
This is before/after analysis which doesn't take natural changes in business into context.
Updated 7 months ago